Tron-like map in JS 😎
Learn how to generate static Tron-like maps filled with dots or hexagons using JavaScript!

For a project I wanted to display locations (pins) on a world map, but wasn't in need for the details nor the interactivity of a Google Maps or OpenStreetMaps. I just wanted to see the outlines of the continents so it was possible to recognise the world and its regions, but nothing more. A static map with as few information as possible. And that looks nice.
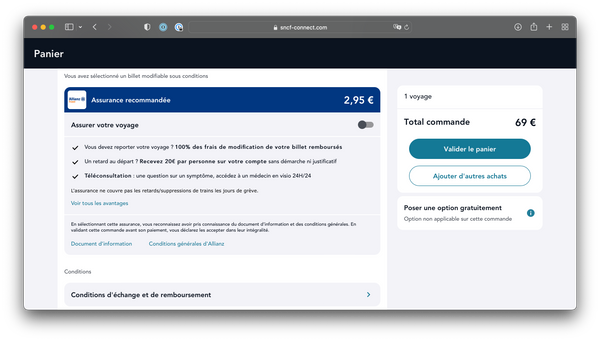
I remembered seing very stylish maps on some websites, like VanMoof careers page:
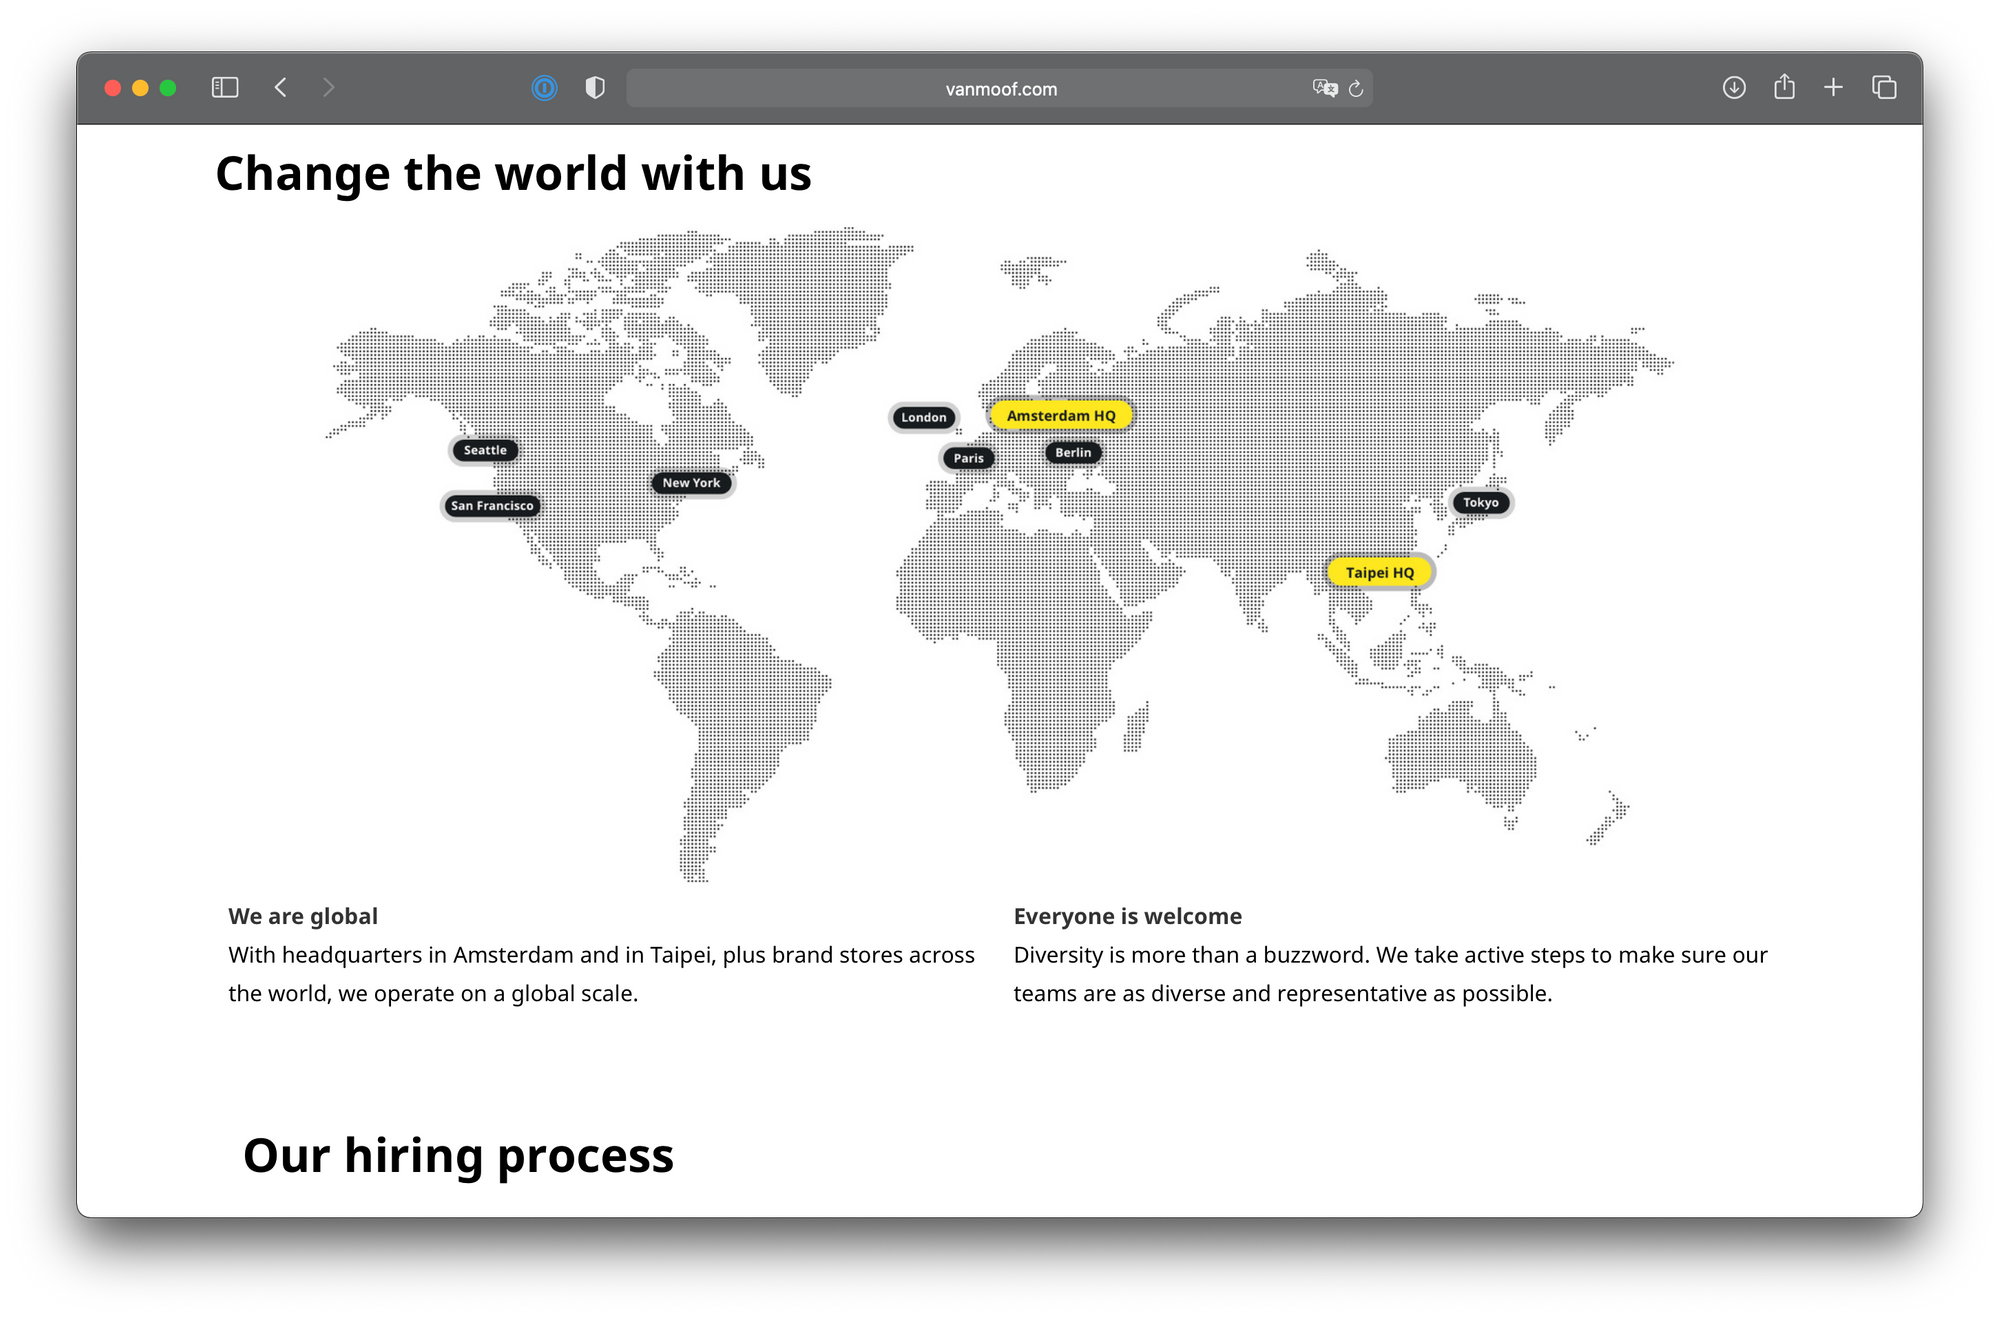
Or the globe in Tron: Legacy, which has been implemented in the beautiful encom-globe:
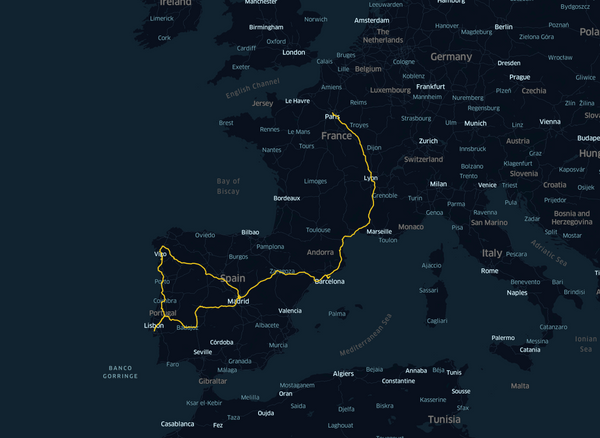
Both (and others) use the same idea: dots or little hexagons to fill the countries, and a single color for the see. No names, no rivers, no borders.
I really liked this idea.
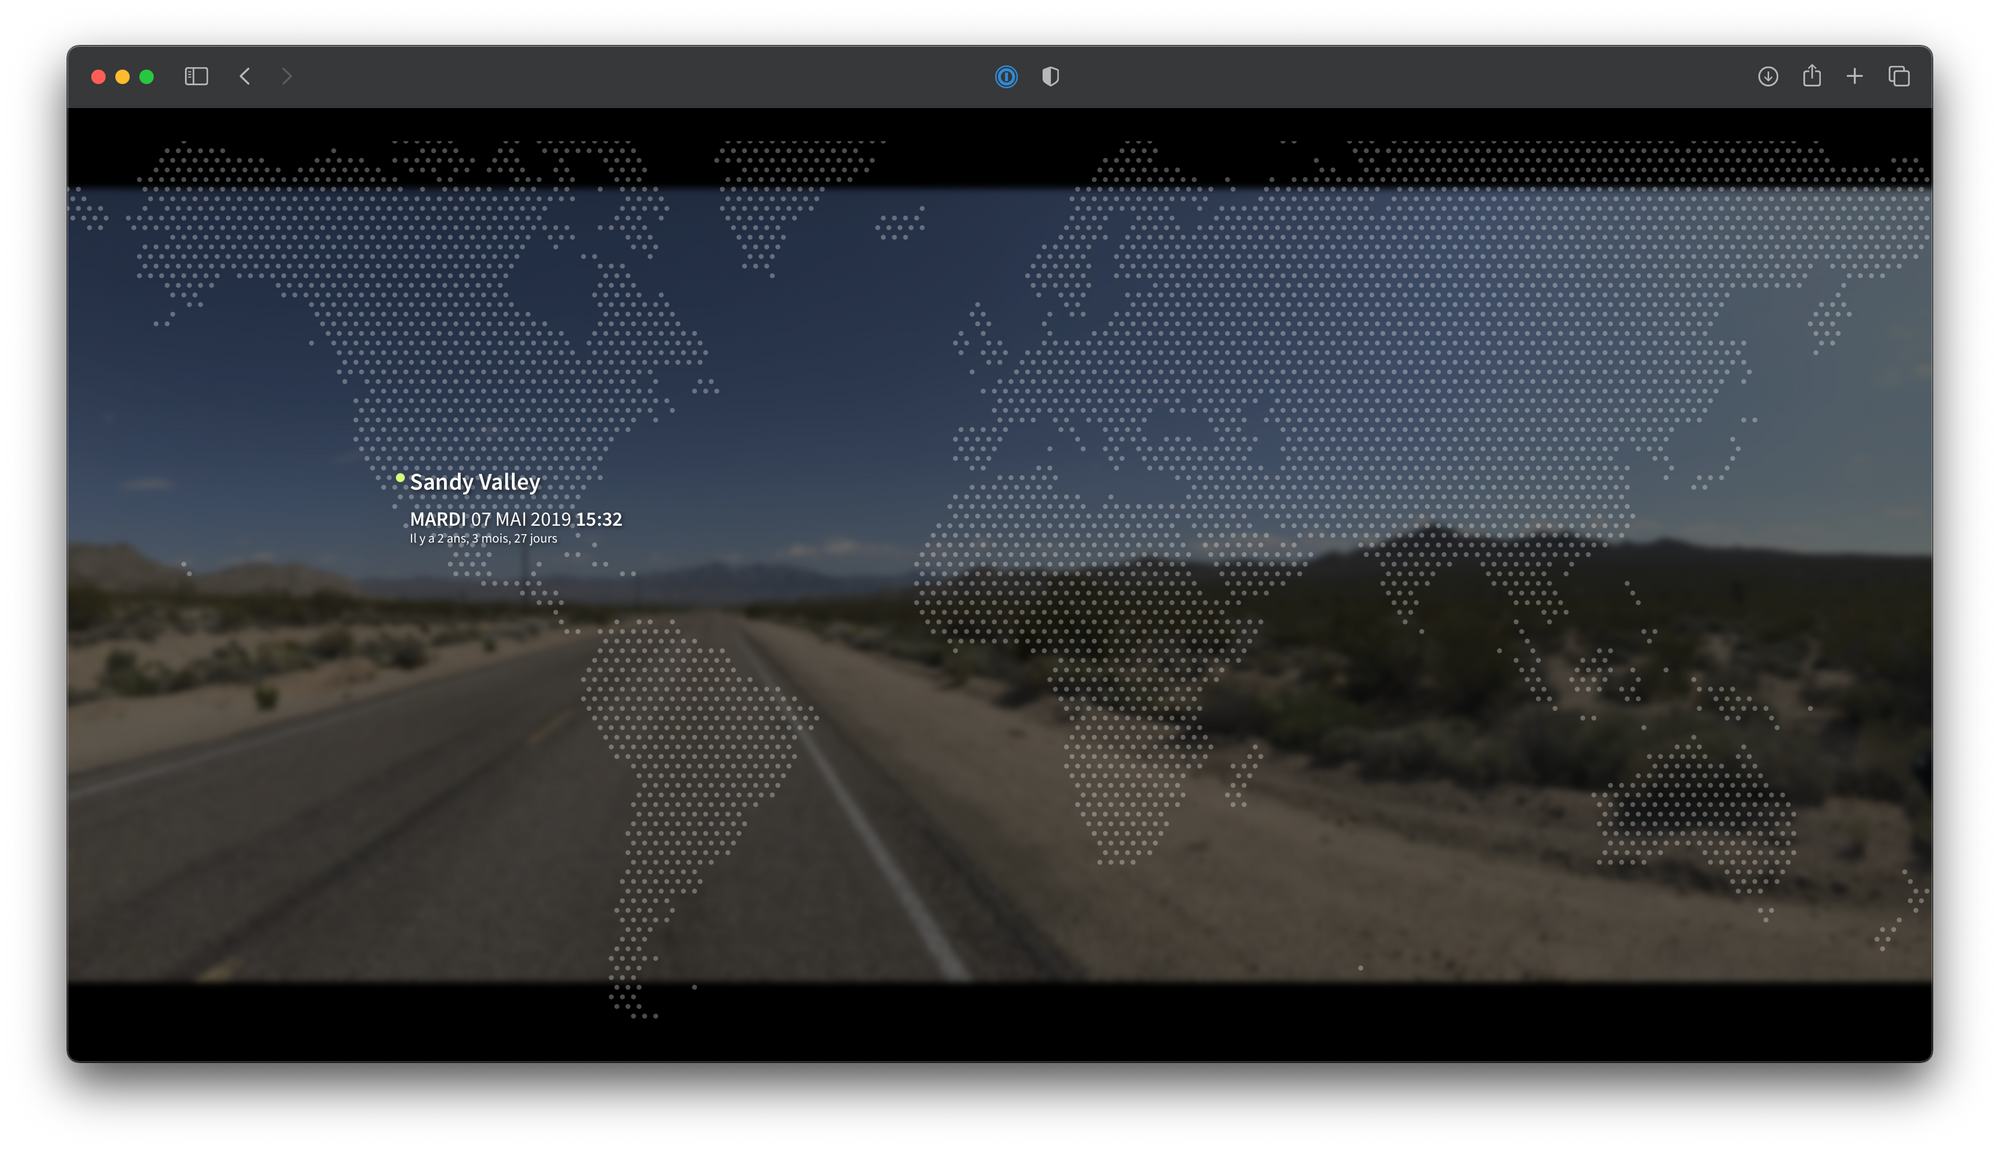
What I "just" needed to do was to generate such a map programmatically, and then to change the color of some points to "add pints".
The result is a JavaScript library: dotted-map (I know, super interesting name, right? Not ashamed of this one 😂).
How to have super nice maps in your app/webapp?
The dotted-map library is available on NPM, and you can see real up-to-date examples in the Readme of the project on Github: https://github.com/NTag/dotted-map
// First things first
npm i dotted-map
// The in yourfile.js
import DottedMap from 'dotted-map';
const map = new DottedMap({ height: 60, grid: 'diagonal' });
map.addPin({
lat: 40.73061,
lng: -73.935242,
svgOptions: { color: '#d6ff79', radius: 0.4 },
});
map.addPin({
lat: 48.8534,
lng: 2.3488,
svgOptions: { color: '#fffcf2', radius: 0.4 },
});
const svgMap = map.getSVG({
radius: 0.22,
color: '#423B38',
shape: 'circle',
backgroundColor: '#020300',
});
// Do what you want with this SVG 💁
The parameters of the library are quit large, you can:
- change the size of the dots
- choose if you want circles or hexagons
- choose if you want the dots to be aligned vetically/horizontally, or in diagonal
- change the region of the world that is visible, or even select some countries
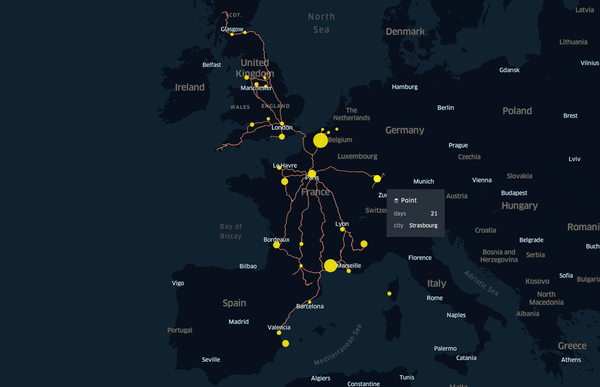
- change the color/size of specific dots on the map (which can be in the land or in the see), to add pins
At the end, you get an SVG, that you can compute and display in your webapp, or in a mobile app if you use React Native for example. You can also use the library on a backend context of course.